Toronto, Montreal and More Drive US Tourism as Canadian Tourists to Miami Rebound in 2026
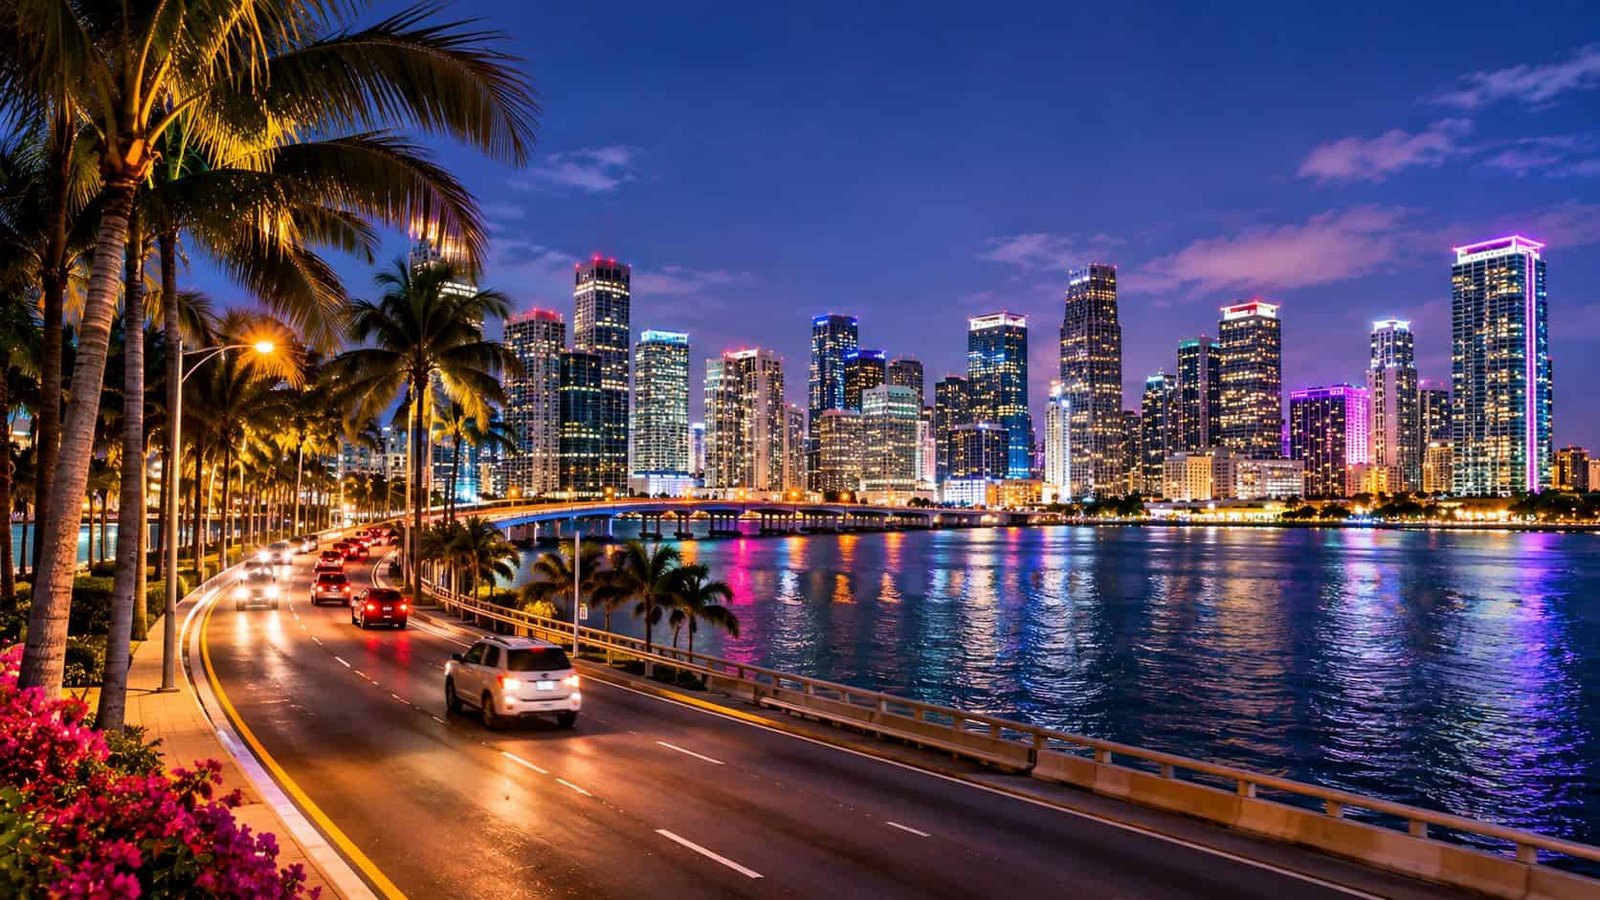
Toronto, Montreal and More Drive US Tourism as Canadian Tourists to Miami Rebound in 2026 

Toronto, Montreal and more Canadian cities drive US tourism as Canadian tourists travelling to Miami rebound in 2026, with arrivals rising 5% to 260,116 between January and October. Toronto led the recovery with 165,505 travellers, recording 7.1% growth, while Montreal contributed 74,158 visitors, increasing 1.1%. Meanwhile, Vancouver experienced strong growth during September and October despite an overall decline. Miami’s warm climate, beaches, cruise connections, shopping attractions and established air links continue to appeal to Canadian holidaymakers. Stronger autumn travel demand further highlights Miami’s growing importance as a winter holiday destination for Canadians seeking sunshine and leisure experiences.
Canada to Miami Travel Increases 5% to 260,116 Travellers in 2026
Canada recorded 260,116 foreign-originating travellers to Miami between January and October 2026, up from 247,685 during the corresponding period in 2025. The increase of 12,431 travellers represents 5% year-on-year growth. February recorded the highest monthly volume at 38,720, followed by March with 38,405 and January with 35,407. Although volumes declined during parts of spring and early summer, the market strengthened considerably from August onward. September delivered the largest year-on-year increase at 46.2%, while October recorded 19,684 travellers, up 29.3%. These figures indicate that Miami’s Canadian travel market gained momentum ahead of the traditional winter holiday season.
Canada to Miami: January–October 2026 Travel Performance
| Month | 2025 Travellers | 2026 Travellers | YoY Change |
|---|---|---|---|
| January | 35,950 | 35,407 | -1.5% |
| February | 38,876 | 38,720 | -0.4% |
| March | 38,536 | 38,405 | -0.3% |
| April | 28,082 | 30,451 | +8.4% |
| May | 23,182 | 22,059 | -4.8% |
| June | 18,688 | 18,114 | -3.1% |
| July | 21,521 | 21,979 | +2.1% |
| August | 18,866 | 22,496 | +19.2% |
| September | 8,756 | 12,801 | +46.2% |
| October | 15,228 | 19,684 | +29.3% |
| Total | 247,685 | 260,116 | +5.0% |
The monthly pattern suggests that Canadian travel demand for Miami remains strongly seasonal. January, February and March generated the highest absolute volumes, consistent with the appeal of South Florida during Canada’s colder months. However, the most significant year-on-year increases occurred in August, September and October. September’s 46.2% growth was particularly notable because it followed a comparatively weak September in 2025. The figures indicate stronger late-year activity, although they do not establish whether the increase resulted from airline capacity, pricing, holiday demand or changes in traveller preferences.
Toronto Leads Canadian Travel to Miami with 165,505 Travellers
Toronto remained Miami’s largest Canadian city source market in the official figures from trade.gov/i-94-arrivals dashboard, generating 165,505 foreign-originating travellers between January and October 2026, compared with 154,601 in 2025. The increase of 10,904 travellers represents 7.1% year-on-year growth. March recorded the highest monthly volume at 25,223, while September delivered the strongest percentage increase at 72.2%. Toronto’s importance reflects its substantial population, commercial activity and established air connectivity with South Florida. Miami’s beaches, cruise terminals, luxury hotels, shopping districts and cultural attractions offer a range of experiences that can appeal to travellers from Canada’s largest metropolitan area.
Toronto to Miami: January–October 2026
| Month | 2025 Travellers | 2026 Travellers | YoY Change |
|---|---|---|---|
| January | 24,371 | 24,401 | +0.1% |
| February | 25,478 | 24,797 | -2.7% |
| March | 25,078 | 25,223 | +0.6% |
| April | 17,132 | 20,118 | +17.4% |
| May | 14,850 | 13,341 | -10.2% |
| June | 10,597 | 10,144 | -4.3% |
| July | 11,498 | 11,700 | +1.8% |
| August | 10,558 | 13,707 | +29.8% |
| September | 4,848 | 8,346 | +72.2% |
| October | 10,191 | 13,728 | +34.7% |
| Total | 154,601 | 165,505 | +7.1% |
Toronto’s contribution is particularly important because it accounts for approximately 63.6% of the Canada-wide total recorded in the official dataset. The city’s strongest travel volumes occurred during the first quarter, when January, February and March each generated more than 24,000 travellers. September’s 72.2% increase and October’s 34.7% growth also indicate a notable improvement in the autumn market. For Miami’s hospitality and cruise industries, Toronto represents a large source of potential demand. However, the data does not identify how many travellers visited for leisure, business, family reasons or cruise connections.
Montreal Strengthens Miami Tourism with 74,158 Travellers
Montreal remained an important Canadian source market for Miami, generating 74,158 foreign-originating travellers during January–October 2026, compared with 73,373 in the same period of 2025. The increase of 785 travellers represents growth of 1.1%. February recorded the highest monthly volume at 10,514, followed by March with 10,135. October delivered the strongest year-on-year increase at 10.8%, reaching 4,390 travellers. Miami’s warm climate, beaches, cruise departures and shopping opportunities remain potential attractions for Quebec residents seeking holidays outside Canada. Montreal’s relatively stable performance provides Miami with another established Canadian market alongside Toronto.
Montreal to Miami: January–October 2026
| Month | 2025 Travellers | 2026 Travellers | YoY Change |
|---|---|---|---|
| January | 8,025 | 7,974 | -0.6% |
| February | 10,008 | 10,514 | +5.1% |
| March | 10,085 | 10,135 | +0.5% |
| April | 8,582 | 7,497 | -12.6% |
| May | 6,767 | 6,792 | +0.4% |
| June | 6,695 | 6,623 | -1.1% |
| July | 8,848 | 9,355 | +5.7% |
| August | 7,289 | 7,633 | +4.7% |
| September | 3,111 | 3,245 | +4.3% |
| October | 3,963 | 4,390 | +10.8% |
| Total | 73,373 | 74,158 | +1.1% |
Montreal’s monthly figures show a market that remained comparatively steady rather than experiencing the substantial cumulative expansion recorded in Toronto. February and March each exceeded 10,000 travellers, while July generated 9,355, suggesting demand across both winter and summer periods. April recorded the steepest year-on-year decline at 12.6%, but positive growth returned during several subsequent months. For Miami, Montreal offers access to Quebec’s French-speaking travel market, where winter sunshine, longer holidays and cruise tourism may influence destination choices. The data indicates continued travel activity but does not establish the reasons behind individual monthly changes.
Vancouver Records Autumn Recovery Despite 10.9% Decline in Miami Travel
Vancouver generated 17,296 foreign-originating travellers to Miami between January and October 2026, down from 19,422 during the corresponding period in 2025. The decline of 2,126 travellers represents a 10.9% contraction. March recorded the largest year-on-year decrease at 40%, while July fell by 23.4%. However, the market showed a substantial improvement toward autumn, with September increasing 57.3% and October rising 47%. Vancouver’s greater distance from Miami may make journey times, airfares and competition from other warm-weather destinations relevant considerations. Nevertheless, the late-year gains indicate renewed activity from western Canada.
Vancouver to Miami: January–October 2026
| Month | 2025 Travellers | 2026 Travellers | YoY Change |
|---|---|---|---|
| January | 3,492 | 2,624 | -24.9% |
| February | 3,325 | 2,238 | -32.7% |
| March | 3,360 | 2,016 | -40.0% |
| April | 2,350 | 2,419 | +2.9% |
| May | 1,537 | 1,862 | +21.1% |
| June | 1,370 | 1,340 | -2.2% |
| July | 1,169 | 896 | -23.4% |
| August | 1,002 | 1,152 | +15.0% |
| September | 763 | 1,200 | +57.3% |
| October | 1,054 | 1,549 | +47.0% |
| Total | 19,422 | 17,296 | -10.9% |
Vancouver’s performance highlights the uneven nature of Canada’s travel recovery to Miami. The market experienced considerable weakness during the first quarter, when January, February and March all recorded double-digit declines. However, growth returned in April and May before accelerating during August, September and October. The September increase of 57.3% was the strongest percentage gain recorded for Vancouver during the period, although it came from a relatively small 2025 base. For Miami tourism businesses, the improvement suggests potential for renewed western Canadian demand, but the overall ten-month decline shows that the market had not recovered to its previous year’s level.
Toronto, Montreal and Vancouver: Canadian Travel to Miami in Numbers
Toronto, Montreal and Vancouver collectively generated 256,959 foreign-originating travellers to Miami between January and October 2026, compared with 247,396 during the corresponding period in 2025. This represents an increase of 9,563 travellers, or approximately 3.9%. Toronto accounted for the largest share of the three-city total, followed by Montreal and Vancouver. The combined figures show that growth in Toronto and Montreal more than offset Vancouver’s decline. However, the city totals should be interpreted within the definitions of the official dataset and should not automatically be treated as unique leisure tourists.
Canadian City Market Comparison: January–October 2026
| City | 2025 Travellers | 2026 Travellers | Net Change | YoY Change |
|---|---|---|---|---|
| Toronto | 154,601 | 165,505 | +10,904 | +7.1% |
| Montreal | 73,373 | 74,158 | +785 | +1.1% |
| Vancouver | 19,422 | 17,296 | -2,126 | -10.9% |
| Combined | 247,396 | 256,959 | +9,563 | +3.9% |
The figures reveal the considerable influence of Toronto on Miami’s Canadian travel market. Its 165,505 travellers represented nearly two-thirds of the three-city total, while Montreal accounted for approximately 28.9% and Vancouver contributed 6.7%. The difference in market size is important for tourism planning because changes in Toronto’s travel volumes can have a larger effect on the combined total. At the same time, Montreal’s stability and Vancouver’s autumn improvement suggest that Miami continues to attract travellers from multiple Canadian regions, even when individual markets experience different growth patterns.
Why Canadian Travellers Continue to Choose Miami
Miami offers several travel experiences that may appeal to Canadian visitors, particularly during the colder months. The city’s beaches, waterfront hotels, restaurants, shopping districts and cultural attractions provide alternatives to winter conditions in Canada. Miami International Airport supports international air connectivity, while PortMiami serves as a major departure point for Caribbean cruises. The destination also offers access to South Florida attractions, including Miami Beach, Wynwood, Little Havana and nearby coastal communities. These characteristics help explain Miami’s established position as a Canadian travel destination, although the official figures do not identify individual visitor motivations.
Seasonality remains an important feature of the market. Canada-wide travel volumes were highest during January, February and March, with each month recording more than 35,000 travellers in 2026. These months coincide with winter conditions across much of Canada, making South Florida’s warmer climate a potential attraction. However, the strongest year-on-year growth occurred later in the year, particularly during September and October. The difference between absolute travel volume and percentage growth is important: a month can record a substantial percentage increase while still generating fewer travellers than the winter peak.
September and October Deliver Strong Growth Across Canadian Markets
The final two months covered by the dataset showed positive year-on-year growth across all three Canadian cities. Toronto recorded increases of 72.2% in September and 34.7% in October. Vancouver followed with growth of 57.3% and 47%, while Montreal increased 4.3% and 10.8%, respectively. Canada-wide figures also improved, rising 46.2% in September and 29.3% in October. These results indicate stronger late-year travel activity compared with 2025, although the increases partly reflect the relatively low volumes recorded during September of the previous year.
September–October 2026: Canadian Travel Growth to Miami
| Origin Market | September YoY | October YoY |
|---|---|---|
| Canada Nationwide | +46.2% | +29.3% |
| Toronto | +72.2% | +34.7% |
| Montreal | +4.3% | +10.8% |
| Vancouver | +57.3% | +47.0% |
For Miami’s tourism industry, the autumn improvement is relevant because it precedes the winter period when Canadian travel volumes have historically been stronger in the official data. Higher travel activity during September and October may support demand for accommodation, restaurants, attractions and cruise departures. However, the available figures do not establish whether the increase resulted from new flight capacity, changes in airfares, promotional activity or broader economic conditions. Further airline schedule and visitor expenditure data would be needed to identify the factors responsible for the improvement.
Miami’s Tourism Industry Benefits from Established Canadian Travel Connections
Canadian travellers form part of Miami’s wider international visitor economy, which supports hotels, restaurants, retail businesses, cultural attractions and cruise operations. Toronto’s substantial travel volume makes it a particularly important market, while Montreal provides consistent additional demand. Vancouver remains smaller and experienced a cumulative decline, but its strong September and October results suggest opportunities for rebuilding travel activity. Miami’s established tourism infrastructure and connections to major Canadian cities give the destination access to different traveller segments, including holidaymakers, business visitors and cruise passengers.
The economic contribution of Canadian travel extends beyond airport arrivals, although the official dataset does not quantify spending. Visitors may purchase hotel accommodation, restaurant meals, local transport, entertainment and retail products during their stays. Cruise passengers may also spend money in Miami before or after sailing. The actual economic effect depends on factors such as length of stay, accommodation choice and travel purpose. Consequently, the increase in foreign-originating travel volumes should be viewed as an indicator of market activity rather than direct evidence of equivalent growth in tourism revenue.
Five Key Findings from Canadian Travel to Miami in 2026
- Canada-wide travel increased 5%, reaching 260,116 foreign-originating travellers during January–October 2026.
- Toronto led the three city markets, recording 165,505 travellers and 7.1% year-on-year growth.
- Montreal generated 74,158 travellers, representing a modest 1.1% increase.
- Vancouver declined 10.9% overall, despite growth of 57.3% in September and 47% in October.
- September delivered the strongest Canada-wide percentage growth, increasing 46.2% compared with September 2025.
What the Canadian Travel Recovery Means for Miami in 2026
The January–October figures show that Miami’s Canadian travel market experienced overall growth in 2026, but the recovery was uneven across individual cities. Toronto generated the largest increase in absolute travel volume, Montreal remained relatively stable, and Vancouver continued to trail its 2025 performance despite a stronger autumn.
The Canada-wide increase of 12,431 travellers suggests that Miami attracted more foreign-originating travel activity from Canada than during the corresponding period in 2025. September and October were particularly strong, with all three city markets recording positive year-on-year changes.
For Miami’s tourism businesses, these developments indicate continued opportunities to attract Canadian visitors through leisure travel, cruise holidays, shopping and cultural experiences. However, the full-year performance will depend on November and December figures, which were not included in the official dataset.
Toronto remains the largest Canadian city source market in the figures, Montreal provides steady demand, and Vancouver’s late-year improvement offers signs of renewed travel activity. Together, their performance illustrates how different Canadian regions are contributing to Miami’s international travel market in 2026.
Toronto, Montreal and more Canadian cities drive US tourism as Canadian tourists to Miami rebound in 2026, rising 5% to 260,116 travellers, fuelled by winter sunshine, cruise holidays and stronger autumn demand.
In conclusion, Toronto, Montreal and more Canadian cities drive US tourism as Canadian tourists travelling to Miami rebound in 2026, supported by stronger autumn travel demand, established air connections and the city’s appeal as a winter holiday destination. Between January and October, Canadian travel to Miami increased by 5%, reaching 260,116 travellers. Toronto led the growth with 165,505 visitors, while Montreal contributed 74,158, reinforcing their importance to Miami’s international tourism market. Although Vancouver recorded an overall decline, its strong September and October performance highlighted renewed travel activity. Miami’s warm climate, beaches, cruise terminals, shopping districts and cultural attractions continue to attract Canadian holidaymakers. The recovery creates opportunities for hotels, airlines, cruise operators and local businesses, although sustained growth will depend on future travel demand and market conditions.
The post Toronto, Montreal and More Drive US Tourism as Canadian Tourists to Miami Rebound in 2026 appeared first on Travel And Tour World.